Portfolio performance report Q2 2018
· 557 words · 3 minutes read
In December of 2017, I started acquiring the first assets of my investment portfolio. Since I thought my experience would be useful to other Belgian investors, I decided to document it through my blog. I subsequently wrote about passive investing in Belgium and the asset allocation in my portfolio.
This is the first report of the performance of my portfolio. It covers December 2017 up until June 30th 2018.
Return
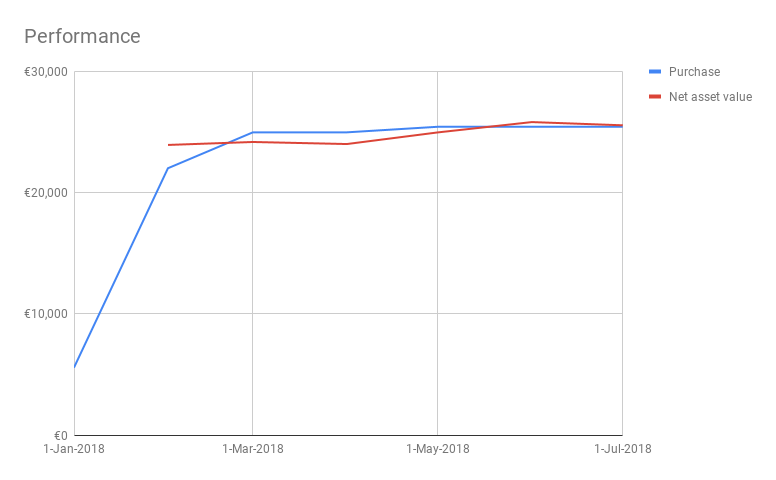
As you can see, I started buying assets in December 2017 and continued purchasing until April 2018. At that moment, I decided to not touch it anymore until I rebalance. During rebalancing I will also invest some new savings.
Here are the most important numbers as of July 1st 2018:
- I spent €25,466 in acquiring my portfolio.
- This number includes the transaction costs which were €84 in total. That means that 0.33% of the purchase value goes to transaction costs.
- The net asset value is €25,564.
- Overall, this means that the return for the first 6 months has been a meager 0.38%. Certainly not a stellar number but I’m not worried as I’m in it for the long run.
Comparison with savings account
At my bank, BNP Paribas Fortis, the annual interest rate is 0.11%. Over half a year, this is roughly 0.06%. Our not-so-good return is still a lot better than just keeping the funds on a savings account!
Comparison with S&P 500
Using this handy calculator we can calculate what the return would have been between December 1st 2017 and July 1st 2018 if we had invested the full amount into the S&P 500: 3.098%. Quite a lot better than our portfolio.
Performance per asset class
Let’s see how the various assets in the portfolio have performed.
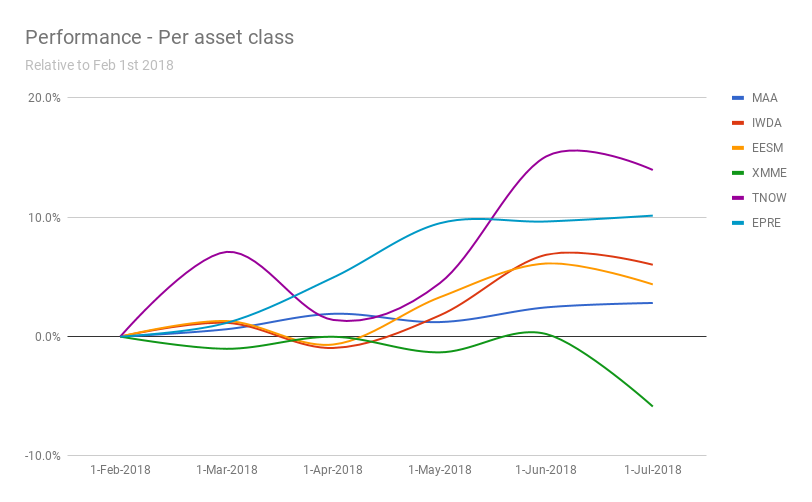
A few observations:
- MAA (MSCI World Index) makes up the biggest asset in my portfolio, at 50%.
- XMME (emerging markets) has been hovering around 0 until last month, when it dropped. I have a suspicion this is caused by the trade wars that were started by Trump.
- TNOW (technology) is an industry-specific fund that represents 3% of the portfolio. I bought it at the very beginning but I now would like to sell it as I am of the opinion that industry-specific funds do not contribute to the diversification of the portfolio.
- EPRE (REIT fund) has been doing very well.
Correlation between asset classes
It is interesting to look at the correlation between the various asset classes because that allows us to test our diversification.
| Correlation | MAA | IWDA | EESM | XMME | TNOW | EPRE |
|---|---|---|---|---|---|---|
| MAA | 1.00 | |||||
| IWDA | 0.71 | 1.00 | ||||
| EESM | 0.64 | 0.95 | 1.00 | |||
| XMME | -0.50 | -0.47 | -0.35 | 1.00 | ||
| TNOW | 0.75 | 0.96 | 0.90 | -0.49 | 1.00 | |
| EPRE | 0.84 | 0.72 | 0.80 | -0.46 | 0.67 | 1.00 |
We can see that the emerging markets fund (XMME) is negatively correlated with all other funds, which is not surprising considering it is the only one that has been going down. Negative correlation is what we want! Because that means that our diversification works.
All the other funds are quite heavily positively correlated.
Conclusion
I have to say that I was expecting a higher return than 0.47%. However, I know that it is still very early and this is only the first report. I’m looking forward to the next one in half a year. That one should also include a rebalancing and a new injection of funds into the portfolio.