Portfolio performance report Q3 2018
· 289 words · 2 minutes read
Changes in the composition of my portfolio
Since last quarter, I made a few changes to my portfolio. I didn’t change any weightings but replaced all of the EU-centric funds with more global funds. This way, I am reducing the exposure to financial problems that may arise in the EU.
- Government bonds I replaced MAA with XG7S. At 0.20% TER, XG7S is slightly more expensive. However, it tracks the FTSE World Government Bond Index, which consists of bonds of all developed countries, whereas MAA only has European bonds.
- Small cap I replaced EESM with IUSN. EESM tracks MSCI Europe Small Caps whereas IUSN tracks MSCI World Small Caps.
- REIT I replaced EPRE with EPRA.
This is what my portfolio looks like today:
| Type | ETF | Allocation | TER |
|---|---|---|---|
| Government bonds | Xtrackers Global Sovereign | 18% | 0.20% |
| Developed | iShares Core MSCI World | 49% | 0.20% |
| Small cap | iShares MSCI World Small Cap | 14% | 0.35% |
| Emerging markets | Xtrackers MSCI Emerging Markets | 10% | 0.20% |
| REIT | Amundi ETF FTSE EPRA NAREIT Global | 9% | 0.24% |
Growth of portfolio
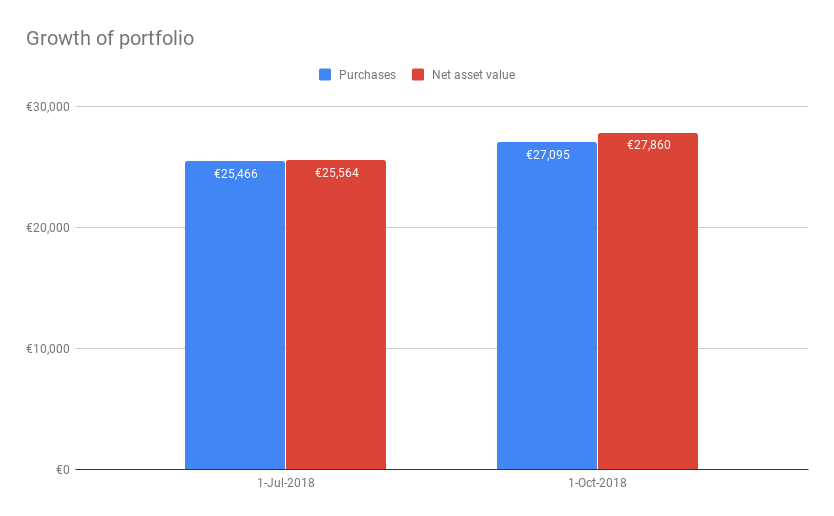
In Q3 of 2018, I invested €1,629 into the portfolio. Also, the total value of my portfolio grew as quite a few asset classes performed well. The 0.39% return from Q2 grew to a 2.83% return. So far, this is quite a lot better than the interest rate you get from a savings account!
Performance per asset
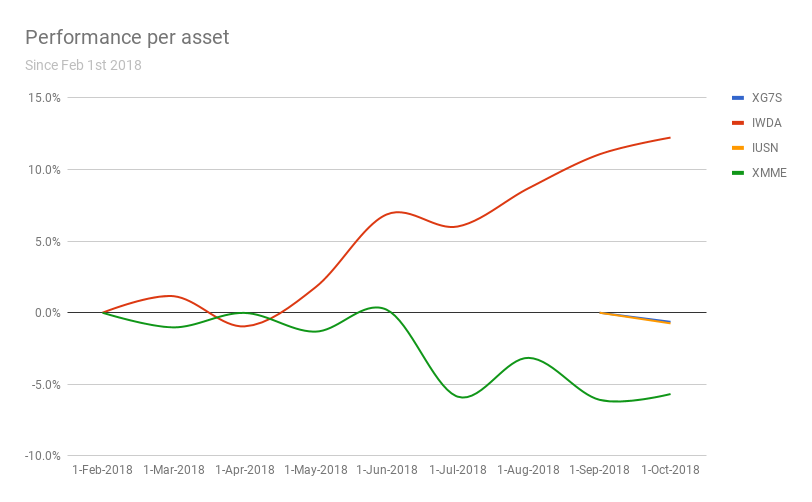
The graph above shows the performance of various assets in my portfolio since February 1st 2018. Note that some data starts later. Those are because of the changes mentioned above. For this reason, there is not so much to say except that stocks seem to be going downwards but bonds are staying stable. This is exactly why we have bonds in our portfolio!